


 Computer Forum
← Zum Grafikkarten-Vergleich 2026
ASUS GeForce RTX 5060 Ti PRIME vs MSI GeForce RTX 5090 Gaming Trio
vs
Schneller
Gesamt-Leistungsindex
100,0
Platz 1 von 30 getesteten Karten
8.300,00 €
Amazon.de
UVP US$1.999
MSI GeForce RTX 5090 Gaming Trio ist im Ø 67,1% schneller
ASUS GeForce RTX 5060 Ti PRIME
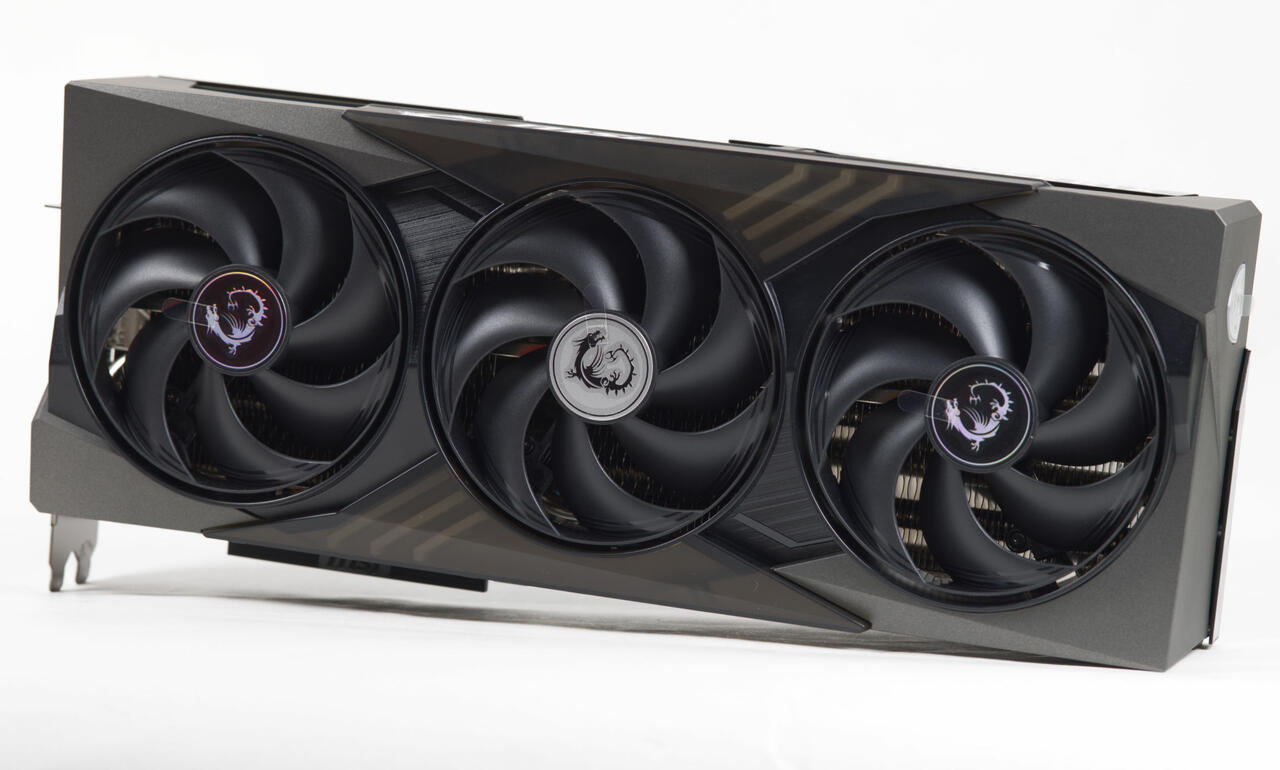
MSI GeForce RTX 5090 Gaming Trio
Einzeltests: ASUS GeForce RTX 5060 Ti PRIME gewinnt 0, MSI GeForce RTX 5090 Gaming Trio gewinnt 41 (41 gemeinsame Tests)
Leistung nach Auflösung
Full HD (1080p)
+51,0 %
71,0fps
145,0fps
4K ohne Raytracing
+68,4 %
49,0fps
155,0fps
4K mit Raytracing
+67,7 %
43,0fps
133,0fps
8K
+76,6 %
33,0fps
141,0fps
Spiele-Benchmarks
ASUS GeForce RTX 5060 Ti PRIME
MSI GeForce RTX 5090 Gaming Trio
Andere getestete Karten
Zeile anklicken öffnet das Diagramm mit allen getesteten Karten; Mouse-over zeigt den Abstand in %.
Ø Full HD (1080p) – alle getesteten Karten
MSI GeForce RTX 5090 Gaming Trio +104,2 %Einzelergebnisse (22 Tests)
3D Mark Fire Strike Extreme Graphic Score 20.182 Punkte 62.516 Punkte +209,8 %
3D Mark Fire Strike Ultra Graphic Score 8.955 Punkte 32.976 Punkte +268,2 %
3D Mark Port Royal v1.32560x1440 10.227 Punkte 38.105 Punkte +272,6 %
3D Mark Port Royal v1.32560x1440 47,4 fps 176,4 fps +272,6 %
3D Mark SpeedWay2560x1440,DX12 Ultimate,fps 40,9 fps 149,1 fps +264,4 %
3D Mark SpeedWay2560x1440,DX12 Ultimate,Score 4.091 Punkte 14.906 Punkte +264,4 %
3D Mark Time Spy Extreme Graphic Score 7.364 Punkte 26.060 Punkte +253,9 %
Black Myth Wukong Benchmark1920x1080, Cinematic,100%, DLSS/FSR, No FrameGeneration,No Raytracing 47,0 fps 110,0 fps +134,0 %
Black Myth Wukong Benchmark1920x1080, Cinematic,100%, DLSS/FSR, No FrameGeneration,Raytracing-Very-High 27,0 fps 87,0 fps +222,2 %
Final Fantasy XV BenchmarkHighest,kein DLSS, 1080p 10.232 Punkte 21.638 Punkte +111,5 %
Fortnite1920x1080 142,4 fps 176,5 fps +23,9 %
Fortnite 1920x1080 P99 215,9 fps 256,8 fps +18,9 %
Fortnite P0.1 35,8 fps 54,3 fps +51,7 %
Geekbench 6.4.0 OpenCL 143.582 Punkte 390.390 Punkte +171,9 %
Geekbench 6.4.0 VULKAN 134.068 Punkte 410.399 Punkte +206,1 %
Metro Exodus P0.1 27,4 fps 82,0 fps +199,3 %
Monster Hunter Wilds Benchmark1920x1080, Ultra+NoDLSS,No-Raytracing 70,8 fps 137,6 fps +94,3 %
Synthetische Benchmarks 469,0 Rating 1.393 Rating +197,0 %
Unigine Superposition1080p Extreme 67,4 fps 206,3 fps +206,0 %
Unigine Superposition 1080p Extreme min FPS 53,0 fps 150,1 fps +183,5 %
Unigine Superposition 1080p Extreme max FPS 79,8 fps 281,8 fps +253,2 %
Unigine Superposition 1080p Extreme Punkte 9.013 fps 27.586 fps +206,1 %
Ø 4K ohne Raytracing – alle getesteten Karten
MSI GeForce RTX 5090 Gaming Trio +216,3 %Einzelergebnisse (9 Tests)
Black Myth Wukong Benchmark3840x2160, Cinematic,50%, DLSS/FSR, No FrameGeneration,No Raytracing 43,0 fps 107,0 fps +148,8 %
Cyberpunk 2077Ultra Preset, 3840x2160 34,7 fps 113,4 fps +227,0 %
Cyberpunk 2077 2.21 Ultra 3840x2160 min 29,6 fps 89,7 fps +203,6 %
Cyberpunk 2077 Ultra 3840x2160 max 42,7 fps 142,3 fps +232,8 %
Final Fantasy XV BenchmarkHighest,kein DLSS,3840x2160 4.540 Punkte 14.058 Punkte +209,6 %
Metro Exodus Ehanced Edition3840x2160 / Extreme 55,5 fps 184,6 fps +232,6 %
Monster Hunter Wilds Benchmark3840x2160, Ultra+NoDLSS,No-Raytracing 33,4 fps 94,6 fps +182,8 %
Shadow of the Tomb RaiderUltra, 3840x2160 70,0 fps 245,0 fps +250,0 %
Shadow of the Tomb RaiderUltra, 3840x2160 11.080 fps 38.229 fps +245,0 %
Ø 4K mit Raytracing – alle getesteten Karten
MSI GeForce RTX 5090 Gaming Trio +209,3 %Einzelergebnisse (8 Tests)
Black Myth Wukong Benchmark3840x2160, Cinematic,50%, DLSS/FSR, No FrameGeneration,Raytracing-Very-High 26,0 fps 85,0 fps +226,9 %
Cyberpunk 2077Low RayTracing Low OHNE DLSS-FSR, 3840x2160 31,0 fps 100,5 fps +224,0 %
Cyberpunk 2077RayTracing Low DLSS / FSR2.1 3840x2160 61,4 fps 162,9 fps +165,3 %
Cyberpunk 2077 2.21 RayTracing DLSS 3840x2160 min 55,6 fps 143,9 fps +158,6 %
Cyberpunk 2077 2.21 RayTracing Low 3840x2160 min 26,4 fps 81,4 fps +208,6 %
Cyberpunk 2077 Low RayTracing Low 3840x2160 max 38,4 fps 124,3 fps +223,5 %
Cyberpunk 2077 RayTracing DLSS 3840x2160 max 72,0 fps 193,1 fps +168,3 %
Metro Exodus P99. Moscow3840x2160 DXR,Ultra,no DLSS 98,5 fps 273,3 fps +177,5 %
Ø 8K – alle getesteten Karten
MSI GeForce RTX 5090 Gaming Trio +327,3 %Einzelergebnisse (2 Tests)
Unigine Superposition8k Extreme 33,0 fps 140,9 fps +326,7 %
Unigine Superposition 8k Optimized 4.414 fps 18.838 fps +326,8 %
Preis-Leistungs-Verhältnis
Jeder Punkt ist eine getestete Karte – je weiter oben links, desto mehr Leistung pro Euro.
Technische Daten
Wichtige Details
| ASUS GeForce RTX 5060 Ti PRIME | MSI GeForce RTX 5090 Gaming Trio | |
|---|---|---|
| Architektur | Blackwell | Blackwell |
| Generation | Blackwell | Blackwell |
| Typ | Desktop-Grafikkarte | Desktop-Grafikkarte |
| UVP zum Release | keine Angabe | US$1.999 |
Detaillierte Spezifikationen
| ASUS GeForce RTX 5060 Ti PRIME | MSI GeForce RTX 5090 Gaming Trio | |
|---|---|---|
| Shader-Prozessoren (CUDA / Stream) | 4.608 | 21.760 |
| Basis-Takt | 2.410 MHz | 2.010 MHz |
| Boost-Takt | 2.570 MHz | 2.410 MHz |
| Leistungsaufnahme (TDP/TGP) | 180 W | 575 W |
VRAM-Kapazität und -Typ
| ASUS GeForce RTX 5060 Ti PRIME | MSI GeForce RTX 5090 Gaming Trio | |
|---|---|---|
| Speichertyp | GDDR7 | GDDR7 |
| Speichergröße | 8 GB | 32 GB |
| Speicherbusbreite | 128 Bit | 512 Bit |
Formfaktor und Kompatibilität
| ASUS GeForce RTX 5060 Ti PRIME | MSI GeForce RTX 5090 Gaming Trio | |
|---|---|---|
| Schnittstelle | PCIe Gen 5 | PCIe Gen 5 |
Konnektivität und Anschlüsse
| ASUS GeForce RTX 5060 Ti PRIME | MSI GeForce RTX 5090 Gaming Trio | |
|---|---|---|
| DLSS | keine Angabe | Nein |
| Resizable BAR | keine Angabe | Nein |
Kaufen
ASUS GeForce RTX 5060 Ti PRIME
Derzeit kein Angebot in unserem Shop-Netz.
MSI GeForce RTX 5090 Gaming Trio
-
amazon.deZum Angebot8.300,00 € VerfügbarStand: 11.11.2026 20:00 Uhr
-
CyberportZum Angebot8.699,00 € VerfügbarStand: 11.11.2026 20:30 Uhr
UVP: US$1.999
Affiliate-Hinweis: Wir verlinken auf Händler wie Amazon, Alternate und Cyberport und erhalten beim Kauf eine Provision. Für dich entstehen keine Mehrkosten. Preise und Verfügbarkeit können sich seit der letzten Aktualisierung geändert haben — der finale Preis auf der Händlerseite ist verbindlich.